Observability Engineering
Get started
জয় শ্রী রাম
🕉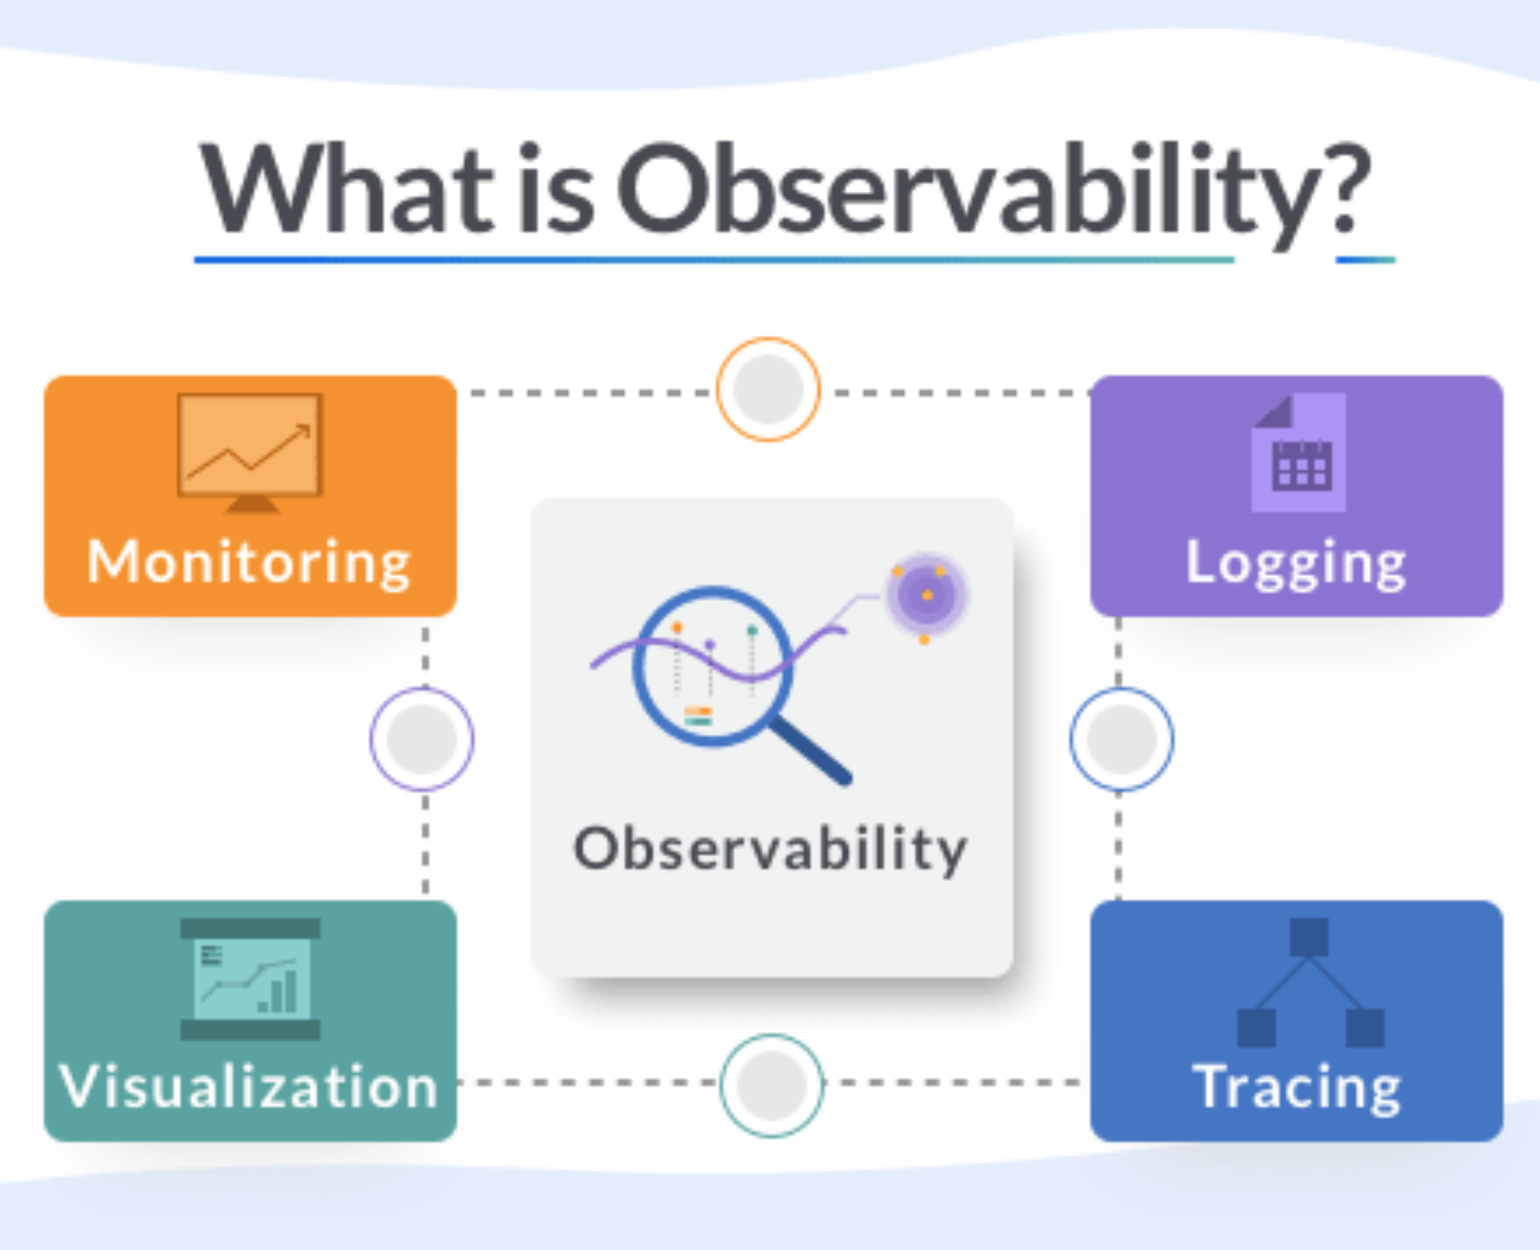
Observability. It’s a buzzword that has been making the rounds in the Software Engineering Operations, DevOps, and Security Ops space for at least a few years. If you are a Software Engineer and/or your job involves understanding or maintaining the functionality and performance of applications and systems, you’ve heard the term used to describe knowing what’s happening with the components of the system. Observability is an important concept for those responsible for the health of any complex IT and software engineering infrastructure. In this chapter we will discuss in depth on what it means and how to achieve it.
Meaning of Observability:
Let's delve into the meaning and origin of the word Observability.In a general sense, to observe something is to watch it carefully with the hope of arriving at a judgment. Something is observable if it can be seen or watched. In physics, an observable is a physical property that can be measured directly, like temperature or position. From observe and observable comes the term observability (think “observe-ability”), the ability to observe. It describes a property of something, so something is either observable or it isn’t.
Origin of the word Observability:
In the technical world, the term observability has its roots in Control Theory, a field of mathematics for dynamic engineering and mechanical systems. A large system can be optimized if the right controls are in place, and those controls can work only if they know how the system is performing. In a system, observability is a measure of how well internal states of a system can be inferred from knowledge of its external outputs. In 1960, Rudolf E. Kálmán introduced the term to describe how well a system can be measured by its outputs. In mechanical systems, sensors and detectors measure the output to inform controls that are in place.In September 2013, engineers at Twitter wrote a blog post called Observability at Twitter. It’s one of the first times the term observability was used in the context of IT systems. It’s especially noteworthy that it is used at Twitter, one of the platforms with the most real-time event data in the world. Engineers at Twitter needed to determine the performance characteristics of their services, the impact on upstream and downstream services, and get notified when services are not operating as expected. The Observability team’s mission was to analyze such problems with an unified platform for collecting, storing, and presenting metrics.
A few years later, Anthony Asta from the Observability Engineering team at Twitter created a blog post called Observability at Twitter: technical overview, part I , where he outlined four pillars of their team’s charter.
The Observability Engineering team at Twitter provides full-stack libraries and multiple services to all their internal engineering teams to monitor service health, alert on issues, support root cause investigation by providing distributed systems call traces, and support diagnosis by creating a searchable index of aggregated application/system logs. he Observability Engineering team at Twitter is responsible for observing all applications and services running in their own data center as well as acquired properties that are deployed in external public clouds, such as Amazon AWS and Google Compute.
The Four Pillars of Observability at Twitter:
The four pillars of Observability are:-
Monitoring
-
Alerting/visualization
-
Distributed systems tracing infrastructure
- Log aggregation/analytics
The Three Pillars of Observability:
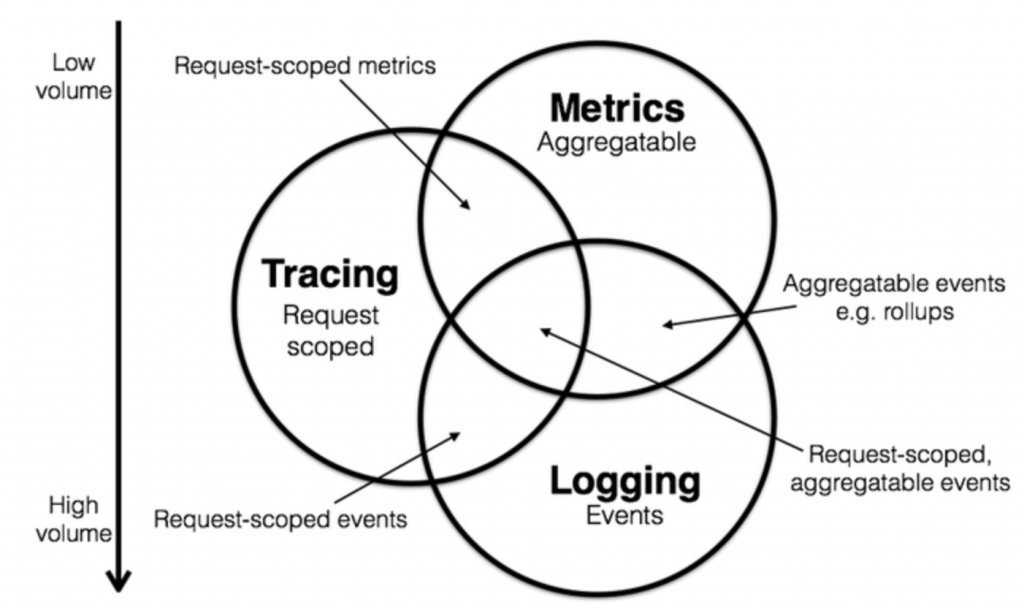
Monitoring and observability rely on signals sent from the workload under scrutiny into the monitoring system. This can generally take the form of the three most common components: metrics, logs, and traces. Some monitoring systems also track and report events, which can represent user interactions with an entire system, or state changes within the system itself.In February 2017, Peter Bourgon attended the 2017 Distributed Tracing Summit. He was part of a discussion about defining and scoping how tracing helps provide observability. In a blog post called Metrics, tracing, and logging, he describes how he thought they could probably map out the domain of instrumentation, or observability, as a sort of Venn diagram,and came up with the below Venn Diagram.
Starting from 2018, observability and the three pillars of logging, metrics, and tracing became part of the mainstream conversation, and tech companies, small and big, all over the world started seeing more and more importance and necessity of having proper observability for their software systems and achieving operational excellence.
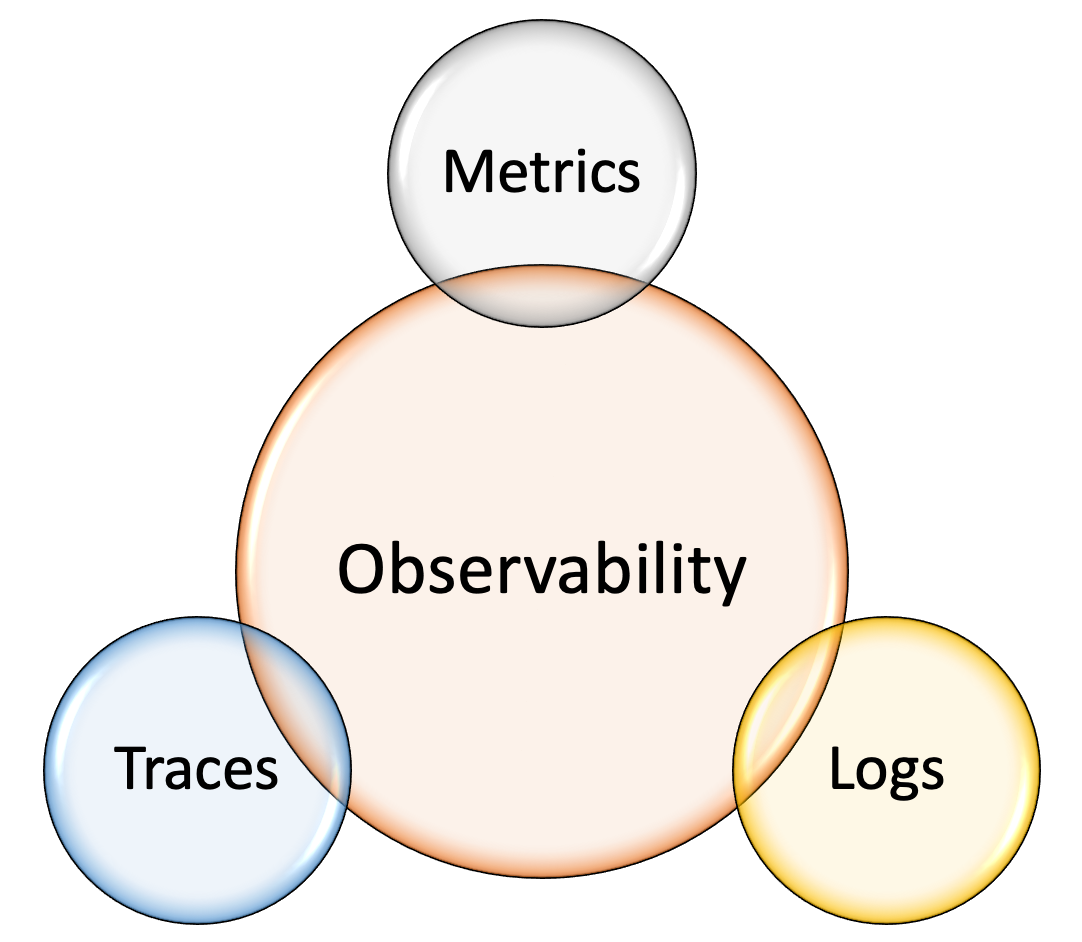
The three pillars of observability are:
- Logs
- Metrics
- Traces
Let's now dive deeper in each of these three pillars.
-
Logs
Logs include application- and system-specific data that provide details about the operations and flow of control within a system. Log entries describe events, such as starting a process, handling an error, or simply completing some part of a workload. Logging complements metrics by providing context for the state of an application when metrics are captured. For example, log messages might indicate a large percentage of errors in a particular API function. At the same time, metrics on a dashboard are showing resource exhaustion issues, such as lack of available memory. Metrics may be the first sign of a problem, but logs can provide details about what is contributing to the problem and how it impacts operations.
An log is an immutable, timestamped record of discrete events that happened over time. Logs in general come in three forms but are fundamentally the same: a timestamp and a payload of some context. The three forms are:
-
Plaintext Logs:
A log record might be free-form text. This is also the most common format of logs.
-
Structured Logs:
Much evangelized and advocated for in recent days. Typically, these logs are emitted in the JSON format.
-
Binary Logs:
Some example of binary logs are MySQL binlogs used for replication and point-in-time recovery, systemd journal logs, the pflog format used by the BSD firewall pf that often serves as a frontend to tcpdump.
Debugging rare or infrequent pathologies of systems often entails debugging at a very fine level of granularity. Event logs, in particular, shine when it comes to providing valuable insight along with ample context into the long tail that averages and percentiles don’t surface. As such, event logs are especially helpful for uncovering emergent and unpredictable behaviors exhibited by components of a distributed system.
Failures in complex distributed systems rarely arise because of one specific event happening in one specific component of the system. Often, various possible triggers across a highly interconnected graph of components are involved. By simply looking at discrete events that occurred in any given system at some point in time, it becomes impossible to determine all such triggers. To nail down the different triggers, one needs to be able to do the following:
-
Start with a symptom pinpointed by a high-level metric or a log event in a specific system
-
Infer the request lifecycle across different components of the distributed architecture
- Iteratively ask questions about interactions among various parts of the system
Traces and metrics are an abstraction built on top of logs that pre-process and encode information along two orthogonal axes, one being request-centric (trace), the other being system-centric (metric).
-
Plaintext Logs:
-
Metrics
Metrics are a numeric representation of data measured over intervals of time. Metrics can harness the power of mathematical modeling and prediction to derive knowledge of the behavior of a system over intervals of time in the present and future.
Since numbers are optimized for storage, processing, compression, and retrieval, metrics enable longer retention of data as well as easier querying. This makes metrics perfectly suited to building dashboards that reflect historical trends. Metrics also allow for gradual reduction of data resolution. After a certain period of time, data can be aggregated into daily or weekly frequency.
Metrics, once collected, are more malleable to mathematical, probabilistic, and statistical transformations such as sampling, aggregation, summarization, and correlation. These characteristics make metrics better suited to report the overall health of a system.
-
Traces
Traces are composed of spans, which are used to follow an event or user action through a distributed system. A span can show the path of a request through one server, while another span might run in parallel, both having the same parent span. These together form a trace, which is often visualized in a waterfall graph similar to those used in profiling tools. This lets developers understand time taken in a system, across many servers, queues, and network hops. A common framework for this is OpenTelemetry.
Distributed tracing is a technique that addresses the problem of bringing visibility into the lifetime of a request across several systems.
A trace is a representation of a series of causally related distributed events that encode the end-to-end request flow through a distributed system.
Traces are a representation of logs; the data structure of traces looks almost like that of an event log. A single trace can provide visibility into both the path traversed by a request as well as the structure of a request. The path of a request allows software engineers and SREs to understand the different services involved in the path of a request, and the structure of a request helps one understand the junctures and effects of asynchrony in the execution of a request.
Although discussions about tracing tend to pivot around its utility in a microservices environment, it’s fair to suggest that any sufficiently complex application that interacts with—or rather, contends for—resources such as the network, disk, or a mutex in a nontrivial manner can benefit from the advantages tracing provides.
The basic idea behind tracing is straightforward—identify specific points (function calls or RPC boundaries or segments of concurrency such as threads, continuations, or queues) in an application, proxy, framework, library, runtime, middleware, and anything else in the path of a request that represents the following:
-
Forks in execution flow (OS thread or a green thread)
- A hop or a fan out across network or process boundaries
When a request begins, it is assigned a globally unique ID, which is then propagated throughout the request path so that each point of instrumentation is able to insert or enrich metadata before passing the ID around to the next hop in the meandering flow of a request. Each hop along the flow is represented as a span. When the execution flow reaches the instrumented point at one of these services, a record is emitted along with metadata. These records are usually asynchronously logged to disk before being submitted out of band to a collector, which then can reconstruct the flow of execution based on different records emitted by different parts of the system.
Having an understanding of the entire request lifecycle makes it possible to debug requests spanning multiple services to pinpoint the source of increased latency or resource utilization.
The use cases of distributed tracing are myriad. While used primarily for inter service dependency analysis, distributed profiling, and debugging steady-state problems, tracing can also help with chargeback and capacity planning.
Some well-known Request Tracing Libraries or Tools or Services are:
-
Forks in execution flow (OS thread or a green thread)
We define observability as the ability to assess an internal system’s state based on the data it produces. An observability platform helps Software Engineering teams, DevOps Teams and SRE Teams observe — or gain deeper insight into — the health and status of different applications and resources across your software engineering infrastructure simultaneously. By garnering insights from each system’s data, Software Engineering teams and SRE Teams can proactively detect abnormalities, analyze issues, and resolve problems.
Observability tools help understand the relationships between systems across your company’s multi-layered IT infrastructure, including cloud environments, on-premises software, and third-party applications. These tools then monitor the health and status of your systems using logs, metrics, and traces—known as the three pillars of observability. When the tool detects an abnormality, it notifies the team and provides the data they need to quickly troubleshoot and solve the issue.
In general, observability is the extent to which you can understand the internal state or condition of a complex system based only on knowledge of its external outputs. The more observable a system, the more quickly and accurately you can navigate from an identified performance problem to its root cause, without additional testing or coding.
In IT and cloud computing, observability also refers to software tools and practices for aggregating, correlating and analyzing a steady stream of performance data from a distributed application along with the hardware and network it runs on, in order to more effectively monitor, troubleshoot and debug the application and the network to meet customer experience expectations, service level agreements (SLAs) and other business requirements.
What is Monitoring?
Observability wouldn’t be possible without monitoring. Generally, monitoring is defined as the collection and analysis of data pulled from software systems. DevOps monitoring uses dashboards— often developed by your internal team—to measure the health of your applications by tracking particular metrics.By giving you information about your application’s usage patterns, monitoring helps software engineers and SREs detect and solve issues. However, for monitoring to work, you have to know which metrics to track. That means data you aren’t tracking could expose issues, and those issues continue to fly under the radar. This illustrates the primary difference between monitoring vs. observability.
Observability is a super-set. Monitoring is a subset of Observability. In general, observability is a broader concept that includes monitoring, but monitoring is a specific practice that is a part of achieving observability.
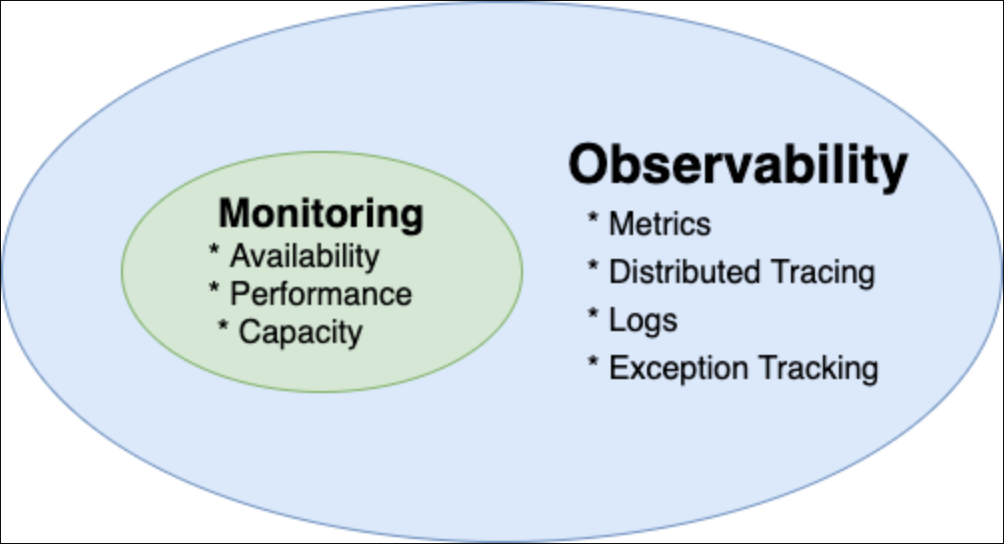
Monitoring is a procedure used to systematically gather, examine, and analyze data to actively monitor performance, maximize beneficial effects, and reduce the risk of negative effects of a system, process, or device over a period of time.
Observability vs. Monitoring: What’s The Difference?
The difference between observability and monitoring focuses on whether data pulled from an IT system is predetermined or not. Monitoring is a solution that collects and analyzes predetermined data pulled from individual systems. Observability is a solution that aggregates all data produced by all IT systems.Most monitoring tools use dashboards to show performance metrics and usage, which IT teams use to identify or troubleshoot IT issues. However, since those dashboards are created by your team, they only reveal performance issues or abnormalities your team can anticipate. That makes it difficult to monitor complex cloud-native applications and cloud environments for security and performance issues, where the security issues teams encounter are often multi-faceted and unpredictable.
By contrast, observability software uses logs, traces, and metrics collected across your entire IT infrastructure to proactively notify IT teams of potential issues and help them debug their systems. While monitoring simply displays data, IT teams can use observability infrastructure to measure all the inputs and outputs across multiple applications, microservices, programs, servers, and databases. By understanding the relationships between IT systems, observability offers actionable insights into the health of your system and detects bugs or vulnerable attack vectors at the first sign of abnormal performance.
The Relationship Between Observability and Monitoring
DevOps’ foundations are monitoring and observability. At its core, monitoring makes observability possible. When DevOps is monitoring applications, they’re often reviewing multiple metrics simultaneously to determine the health and performance of each application. Collecting and displaying the data from different IT systems is essential to program monitoring in DevOps because it shows when a system or application is experiencing an issue. But, without observability, it’s difficult for teams to discover the root cause of the performance issue.Observability and monitoring tools work together to offer robust insight into the health of your IT infrastructure. While monitoring alerts the team to a potential issue, observability helps the team detect and solve the root cause of the issue. Even when a particular endpoint isn’t observable, monitoring its performance still plays a vital role—it adds more information to help triage and diagnose any concerns within the system as a whole.
Similarly, visibility contributes to the overall relationship between observability and monitoring. Visibility into an isolated system makes observability into potential issues possible, but only into one element of your IT infrastructure. The key difference between observability vs. visibility is scope—observability offers perspective across multiple tools and applications, while visibility focuses on just one. However, when visibility is combined with monitoring, it can offer a solution to detect both expected and unexpected performance issues for endpoints or systems that aren’t observable within your IT infrastructure.
What is Telemetry?
Telemetry is the ability to collect data—including logs, metrics, and traces—across disparate systems, especially in dynamic cloud environments or across cloud-native applications.Telemetry enables Monitoring. Telemetry makes monitoring possible across remote or disparate parts of your IT infrastructure. While many monitoring tools aren’t equipped to support cloud-native environments, telemetry offers more robust monitoring capabilities across all tools and applications. This can help developers detect security issues or bugs that regular monitoring wouldn’t have caught.
Additionally, while traditional monitoring tools can only track specific metrics defined by developers, telemetry can help developers track the overall health of certain systems.
What is Logging?
Services should only log actionable information. That includes serious, panic-level errors that need to be consumed by humans, or structured data that needs to be consumed by machines. An example of the former would be a message signaling that a required database has become completely unavailable. An example of the latter would be a message indicating a media object has been played, recorded so an end-of-day batch process might calculate owed royalties. Logs read by humans should be sparse, ideally silent if nothing is going wrong. Logs read by machines should be well-defined, ideally with a versioned schema.Because logging has relatively limited applicability, I tend to favor log packages with a minimum surface area. Avoid multiple production log levels (info, warn, error) and especially runtime level configuration. After all, you should only be logging information that needs to be seen! An exception is debug logging, which is useful during development and problem diagnosis.
Finally, understand that logging is expensive. Resist the urge to log any information that doesn’t meet the above criteria. As a concrete example, logging each incoming HTTP request is almost certainly a mistake, especially on a service that’s in the hot-path for your product. That kind of high-volume data is a better match for instrumentation.
What is Instrumentation?
Instrumentation is for all remaining diagnostic information about your service. In contrast to logging, services should instrument every meaningful number available for capture. Metrics are (or should be) cheap to record and report, and instrumentation systems are more useful the more data they contain, which is a virtuous cycle: the more you have, the better-off you are.To make use of a monitoring system, your system must be instrumented. That is, code must be added to a system in order to expose its inner state. For example, if a simple program contains a pool of connections to another service, you might want to keep track of the size of that pool and the number of unused connections at any given time. In order to do so, a developer must write some code in the connection pool logic to keep track of when connections are formed or destroyed, when they are handed out, and when they are returned. This might take the form of log entries or events for each of these, or you might increment and decrement a gauge for the size of the queue, or you might increment a counter each time a connection is created, or each time a pool is expanded.
Instrumentation refers to the practice that developers insert logging code into source code to record runtime information. Instrumentation is the process of adding code to your application so you can understand its inner state. Instrumented applications measure what code is doing when it responds to active requests by collecting data such as metrics, events, logs, and traces. In contrast to an application that isn’t instrumented and only uses point-in-time logs, an instrumented application tracks as much information as possible about the service’s operations and behavior. It provides more detail about what is happening, so you can see relationships between requests.
Good initial candidates for instrumentation include the things you’ve left out of your logging. That tends to be things like incoming request counts, request durations, and error counts. At the minimum, you capture Request rate (count), Error rate (count), and Duration of requests, RED in short.
Most instrumentation libraries have (at least) three main primitives:
-
A counter, for recording events that happen, e.g. incoming requests, bad request errors, etc.
-
A gauge, for recording things that fluctuate over time, e.g. the size of a threadpool.
-
A histogram, for recording observations of scalar quantities of events, e.g. request durations.
Both logging and instrumentation are ultimately just methods to achieve system observability. The above guidelines provide a good foundation for any microservice architecture.
What is incident alerting?
Incident alerting is when monitoring tools generate alerts to notify your team of changes, high-risk actions, or failures in the software environment.For example, a system built to allow doctors to prescribe medication may generate an alert if the dose a doctor requests is unusually high, not matching up with the body weight listed in a patient file, or poses a drug interaction risk with other common medications.
Similarly, a system built to monitor a tech product may generate an alert if a system goes offline, web requests are taking longer than usual to process, or database latency slows beyond a set threshold.
The goal of IT alerting is to quickly identify and resolve issues that impact product uptime, speed, and functionality—around the clock and without manual monitoring.
Alerting Best Practices:
Incident alerts are undeniably an important part of incident management, but the truth is that they’re not just a simple fix you can set and forget. Setting alert thresholds too low can lead to overflowing inboxes, unhappy on-call teams, and alert fatigue. Setting thresholds too high can mean missing critical issues and costing the company millions. Which is why the most effective alerting systems are set up with these best practices in mind.-
Automate your monitoring
The best way to quickly and effectively identify issues is to automate monitoring.
Is a database responding slower than usual? Are users experiencing slower-than-average load times on your app? Is a vital system down? Has one of your technicians made a request that seems like a red flag? Your system should automatically be watching out for problems like these and letting you know when they arise.
-
Set smart alerting thresholds
Does every alert need immediate attention? For most companies, the answer is no—which is why you need to set sensible alert thresholds.
Knowing whether something is worth waking a developer in the middle of the night—or if it can wait until morning—can be the difference between happy developers with fast response times and alert-fatigued teams who spend their weekends looking for a new job.
-
De-duplicate your alerts
A study on alert fatigue found that—for clinicians in a hospital setting—alert attention dropped by 30% every time a duplicate alert came in. And it’s likely that the study results would be the same for developers. The more we see the same alert, the less we pay attention to it. Which is why the best practice here is to de-duplicate your alerts and minimize reminders.
-
Set priority and severity levels
Obviously, some alerts are more important than others. A website outage is probably going to take precedence over a brief slow-down on an infrequently-used feature. Malicious hacking is probably a higher priority than an image that isn’t rendering correctly in your app.
Not only should your system recognize alert priority and severity, but it should also communicate that priority clearly to the people responsible for resolving incidents. The best practice here is to use visual, audible, and sensory cues to quickly and clearly indicate what teams should focus on next.
-
Make alerts actionable
Knowing what’s wrong is good. Knowing what to do next is better. Which is why if your alerts aren’t actionable, they should be.
This is one place where DevOps teams can learn from the aviation industry. When an alert shows up on pilot’s dashboard during a flight, it comes with an actionable checklist. Building this kind of detail into your alert system cuts down on diagnostic time and helps developers move quickly through your process.
This is especially helpful when a developer is up in the middle of the night, bleary-eyed and not at the top of their game.
Monitoring and Observability
To do a good job with monitoring and observability, your teams should have the following:- Monitoring Service Health and Reporting on the overall health of systems (Are my systems functioning? Do my systems have sufficient resources available?).
- Reporting on system state as experienced by customers (Do my customers know if my system is down and have a bad experience?).
- Monitoring for key business and systems metrics.
- Tooling to help you understand and debug your systems in production.
- Tooling to find information about things you did not previously know (that is, you can identify unknown unknowns).
- Access to tools and data that help trace, understand, and diagnose infrastructure problems in your production environment, including interactions between services.
Monitoring and observability solutions are designed to do the following:
- Provide leading indicators of an outage or service degradation.
- Detect outages, service degradations, bugs, and unauthorized activity.
- Help debug outages, service degradations, bugs, and unauthorized activity.
- Identify long-term trends for capacity planning and business purposes.
- Expose unexpected side effects of changes or added functionality.
Learning and Improving:
Part of operating a system is learning from outages and mistakes. The process of writing retrospectives or postmortems with corrective actions is well documented. One outcome of this process is the development of improved monitoring. It is critical to a fast-moving organization to allow their monitoring systems to be updated quickly and efficiently by anyone within the organization. Monitoring configuration is critical, so changes should be tracked by means of review and approval, just as with code development and delivery. Keeping your monitoring configuration in a version control system is a good first step in allowing broad access to the system, while maintaining control on this critical part of your system. Developing automation around deploying monitoring configuration through an automation pipeline can also improve your ability to ensure these configurations are valid and applied consistently. After you treat your monitoring configuration as code, these improvements can all be accomplished by means of a deployment automation process, ideally the same system used by the rest of your team.Design Large-Scale Real time Analytics System:
Now that we have gained deep understanding on how to achieve Operational Excellence using Observability, Monitoring, Alerting, Telemetry and Log Instrumentation, let's design a large-scale real time analytics system which will focus on metrics monitoring and alerting.
What we are going design now is going be the foundational piece of any Observability Platform, Large-Scale Alerting and Monitoring System, or Real-time Analytics System.
So, you will be able to leverage what we are going to learn now in the following use cases:
- Design Large-Scale Metrics Monitoring, Alerting and Logging System
- Design Real-time Analytics Platform
- Design Observability Platform
Login to Access Content